Communicable Disease Dashboard (Public Health)
The Public Health Company, 2025 · Case study by Will Dzierson
Tags: Prototyping, Software Development, UX, TypeScript, Healthcare
My contribution
I came on as the founding designer — the first and primary design voice on the product — working directly with the PHC leadership team, epidemiologists, and enterprise clients to define what the platform needed to be.
My work spanned the full design process: stakeholder interviews and domain research to understand how enterprises actually respond to health risk events; information architecture and data modeling to determine how to surface location-based risk in a way that was scannable and decision-ready; and end-to-end UX and visual design across the dashboard, alert system, and location drilldown views.
Beyond design, I built working prototypes in TypeScript to pressure-test the interface under real data loads, collaborating with the engineering team to bridge the gap between design intent and implementation. The prototypes were used directly in client demos and stakeholder reviews, which significantly accelerated feedback cycles and buy-in from enterprise accounts.
The work
The Public Health Company was built around a clear and urgent problem: global enterprises — Fortune 50 companies, hospitals, hotel chains, manufacturers — have almost no visibility into communicable disease risk at the operational level. PHC set out to change that by building real-time intelligence tools that help companies protect their people, offices, and supply chains from outbreaks like Covid, H5N1, and other pathogenic threats.
I joined as the founding designer, brought in to translate a complex, data-heavy domain into something actionable and usable for on-the-ground staff and executives alike. The core product was a risk dashboard that aggregated disease signals by location — giving enterprise clients a live view of risk scores across their global assets, with alerts tied to severity thresholds and recommended response protocols. The challenge wasn't just making it readable — it was making it trustworthy and fast enough to act on during an active outbreak.
Working directly with public health experts, physicians, and enterprise stakeholders across the US, Asia, and Europe, I led the design from research through high-fidelity prototyping, including building working front-end prototypes in TypeScript to validate interaction patterns under realistic data conditions.
Images and video
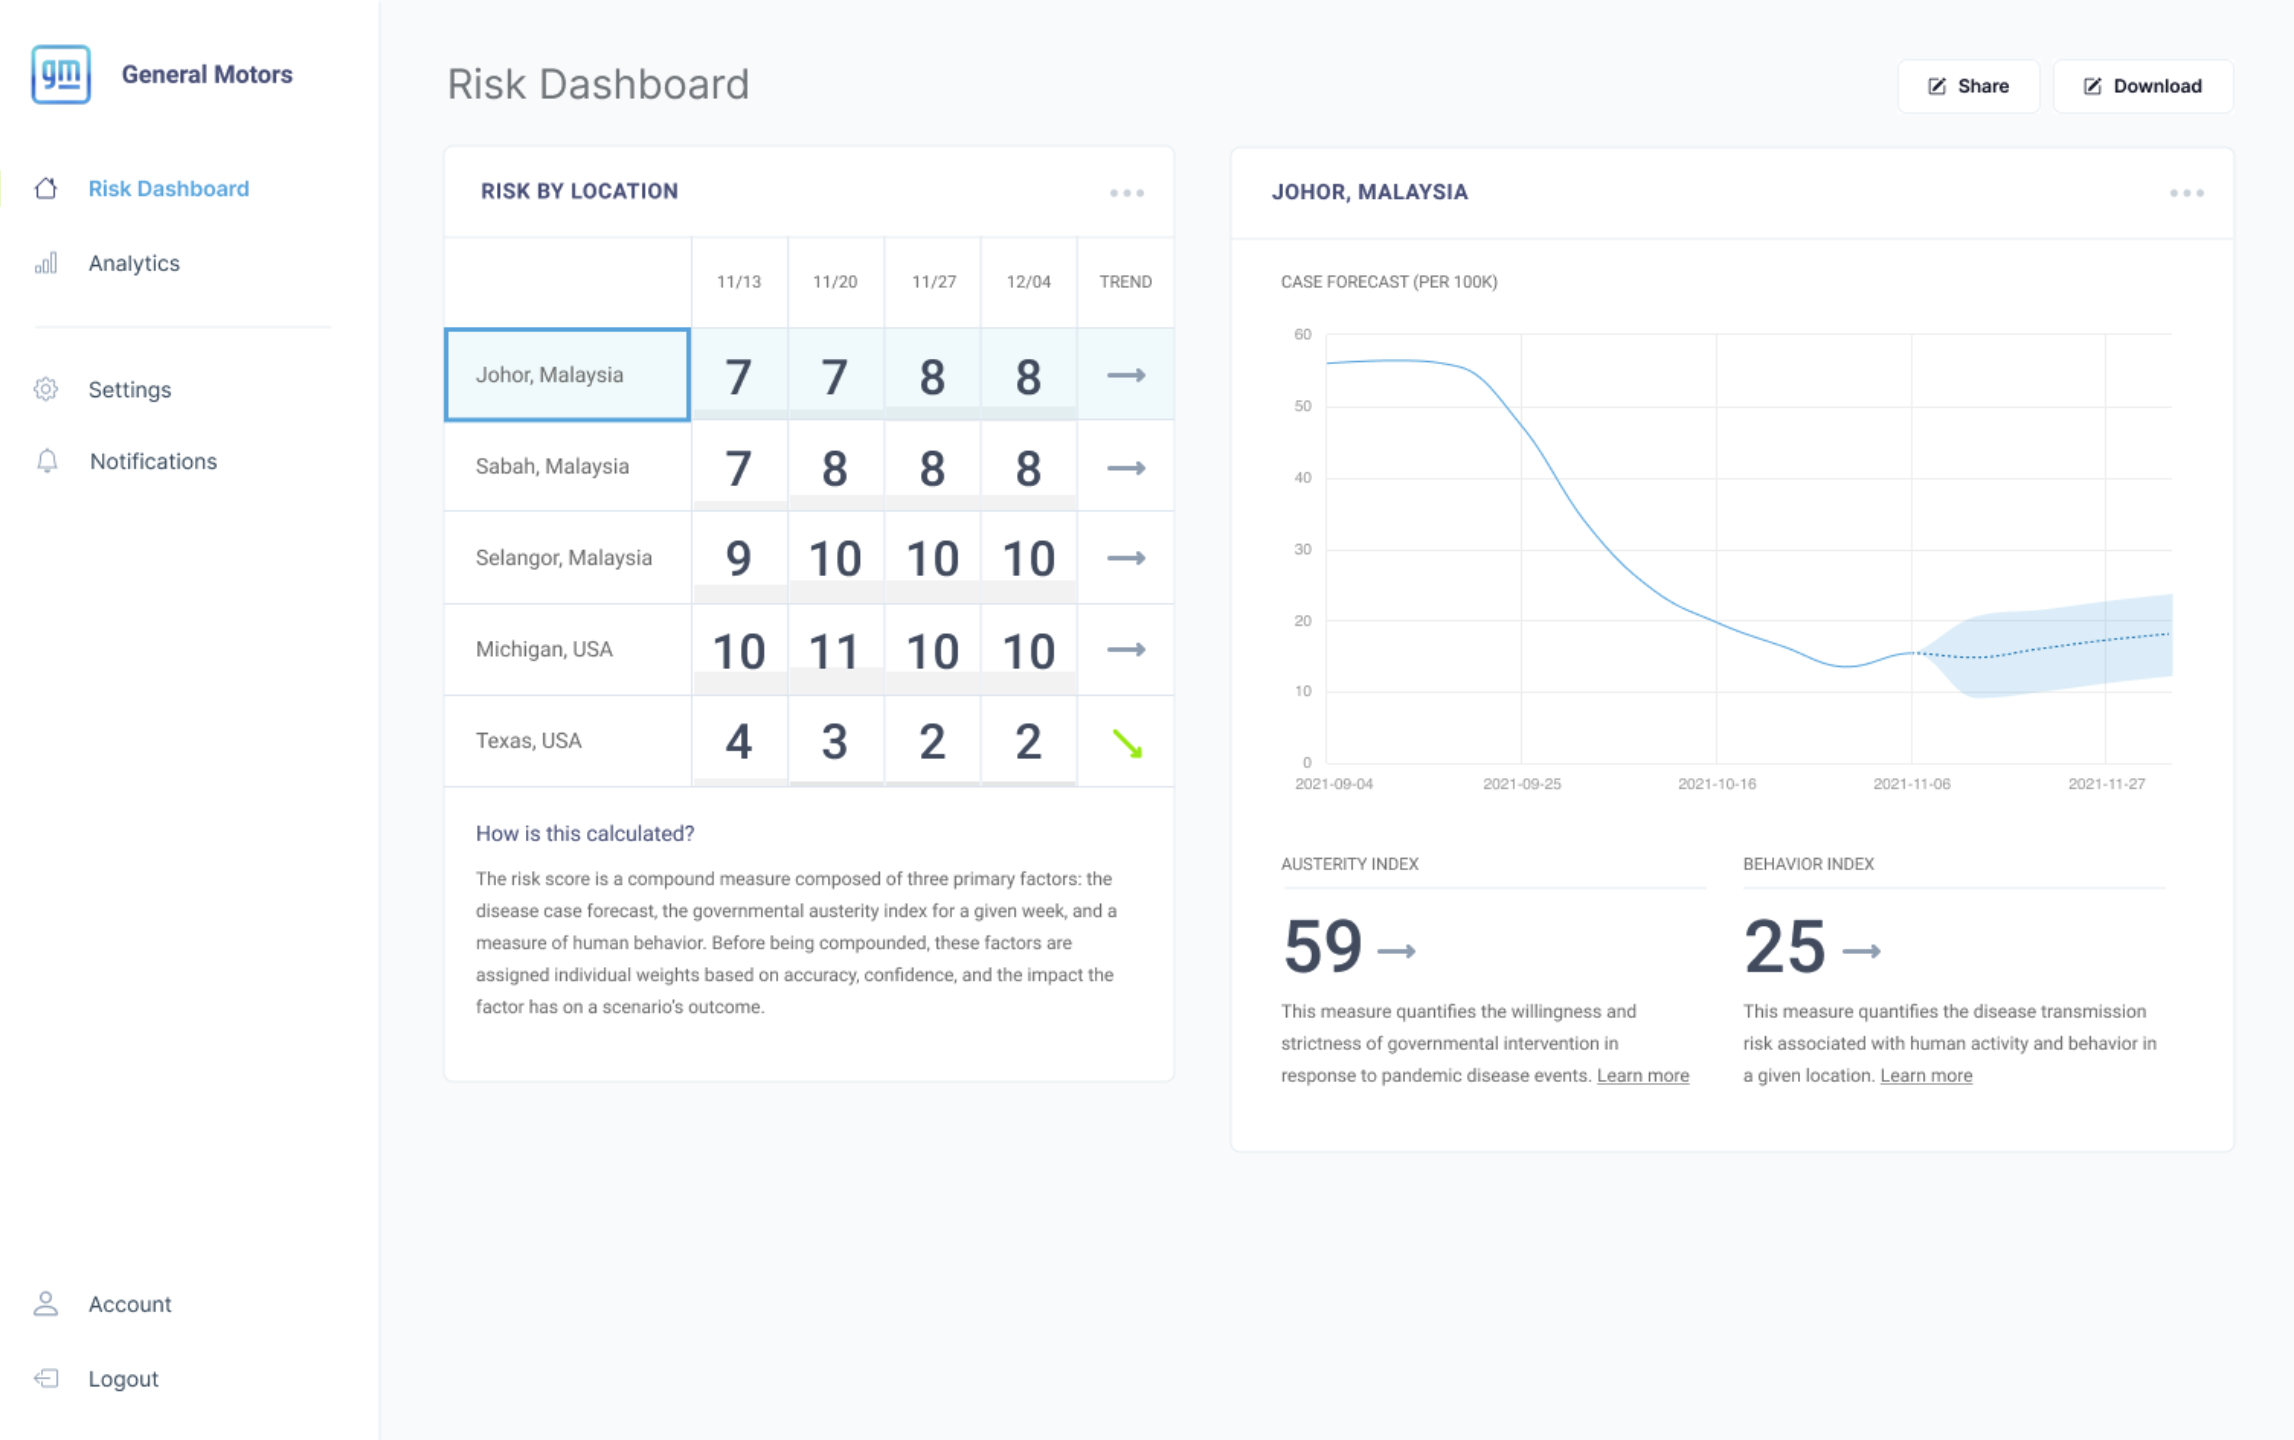
- The Risk Dashboard showing a location-specific view for Johor, Malaysia — with weekly risk scores, actuality index, and behavior index surfaced for a selected enterprise asset. The composite risk score is built from three factors: disease case forecast, governmental activity index, and human behavior signals.
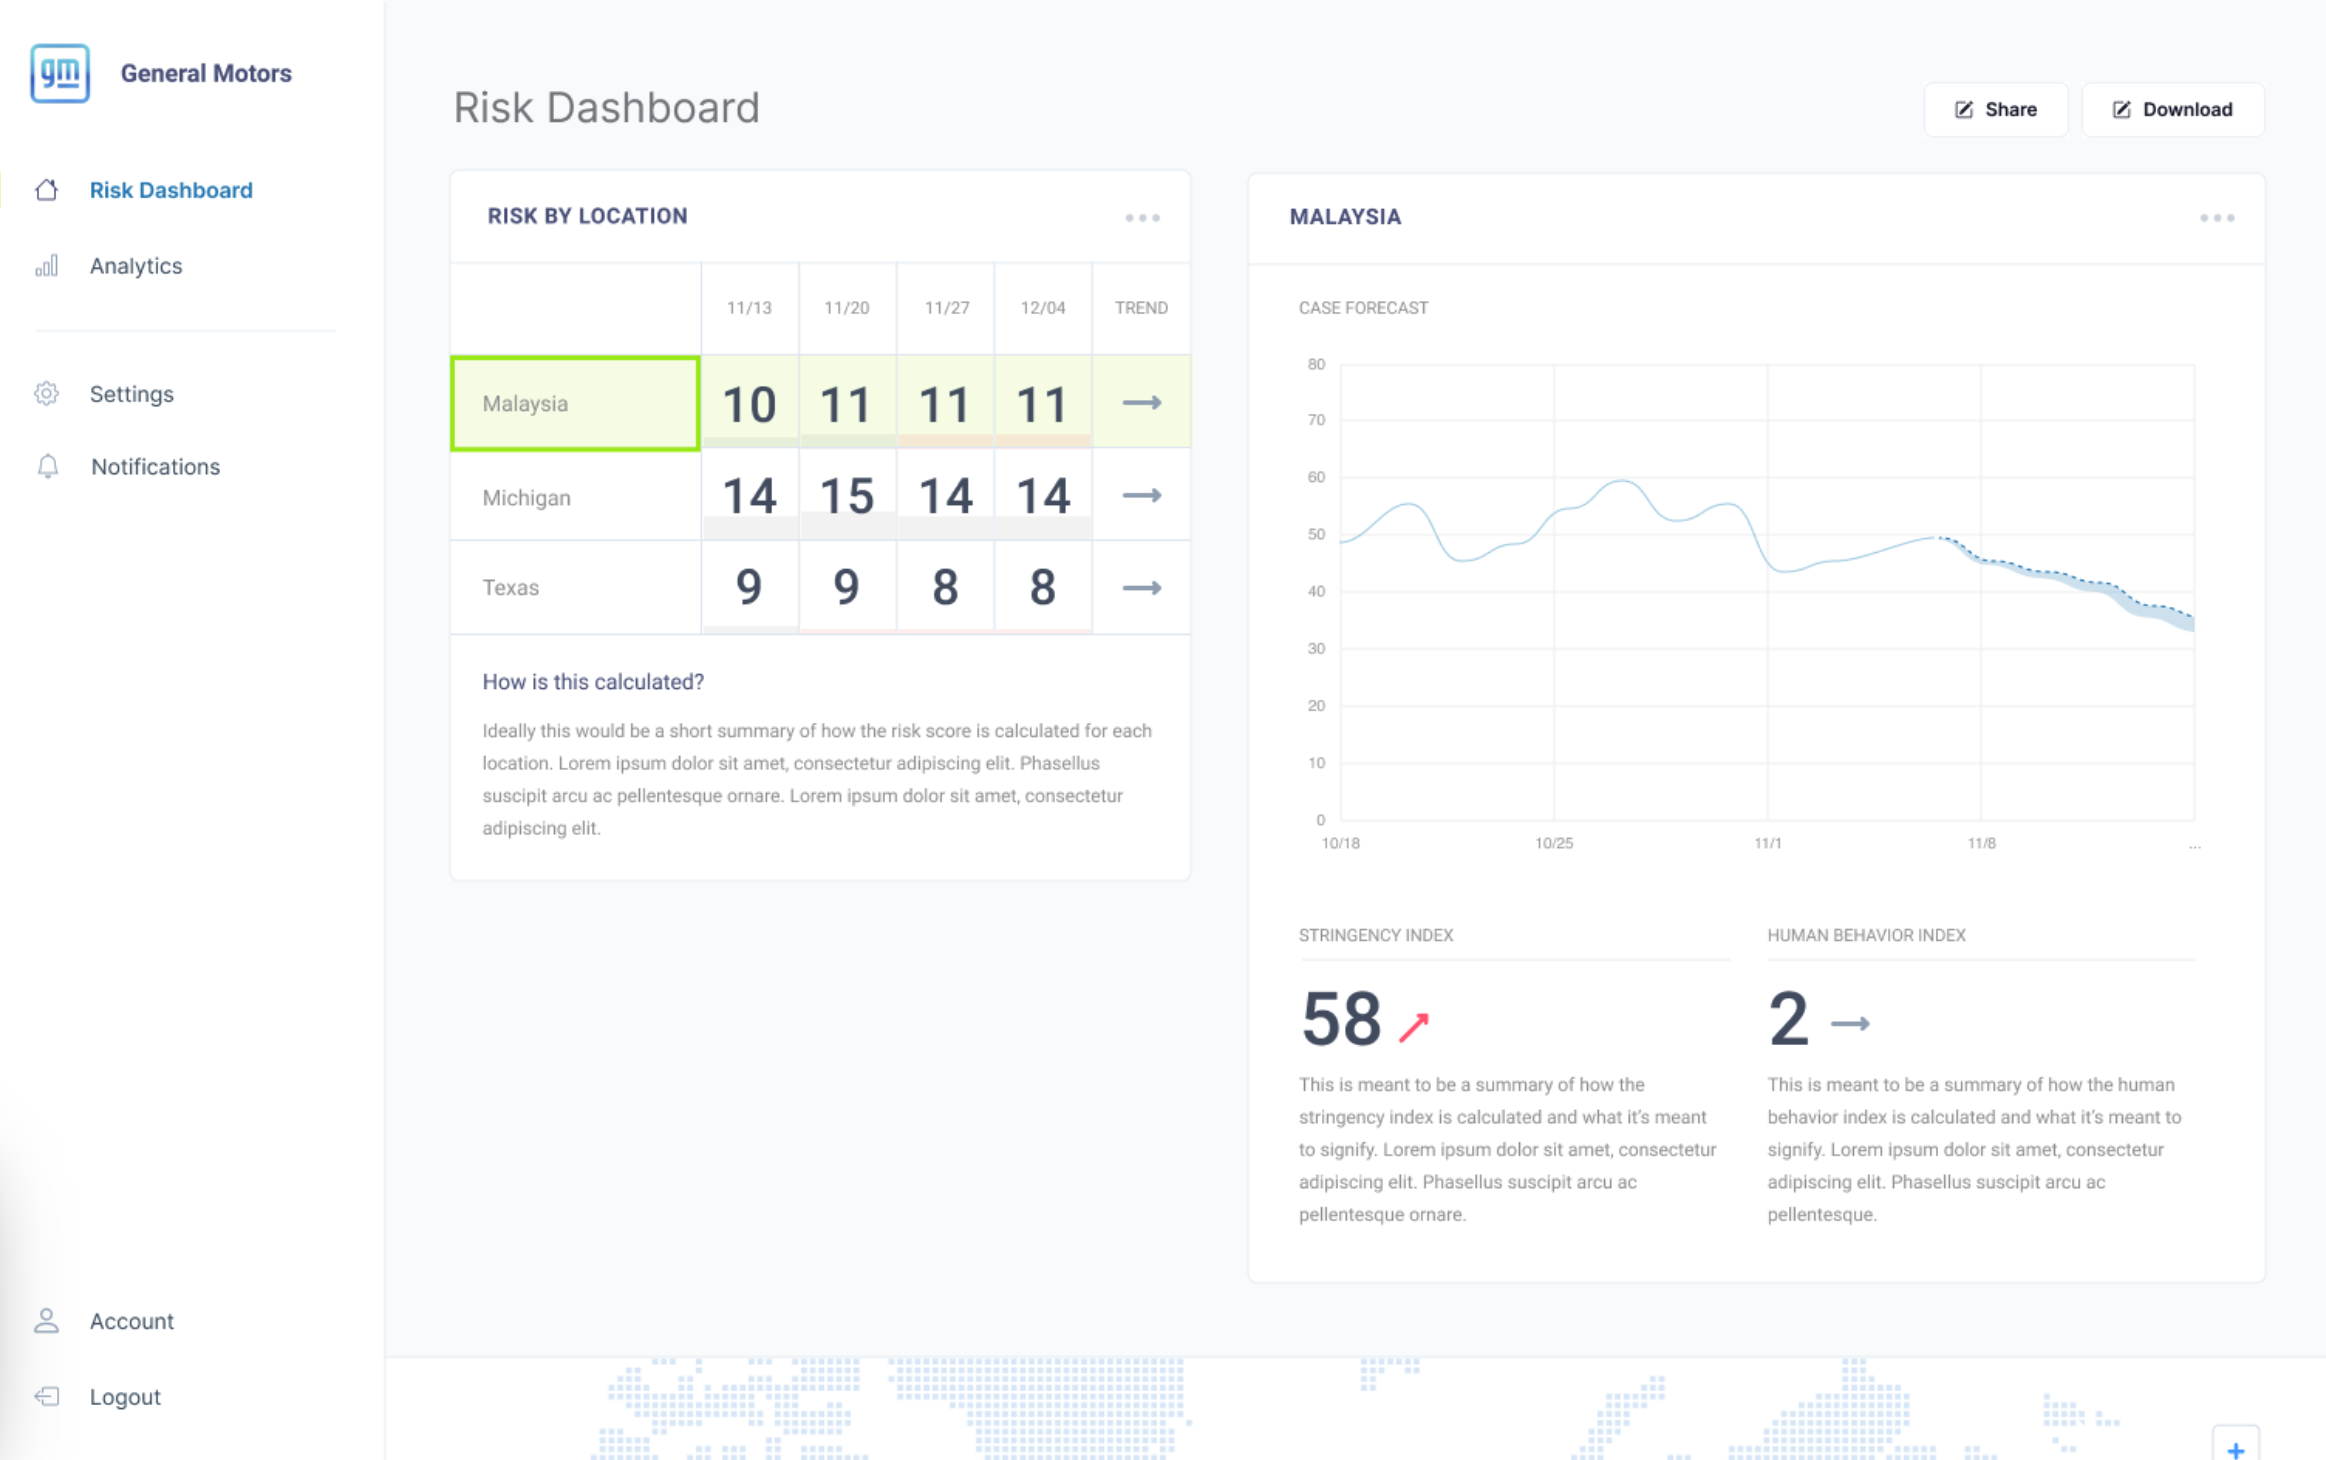
- A country-level view of Malaysia in the Risk Dashboard, showing aggregated risk scores across multiple regions and a forecast trend line. As users drill into a location, the interface surfaces region-specific data to help enterprise teams prioritize response efforts across their asset footprint.
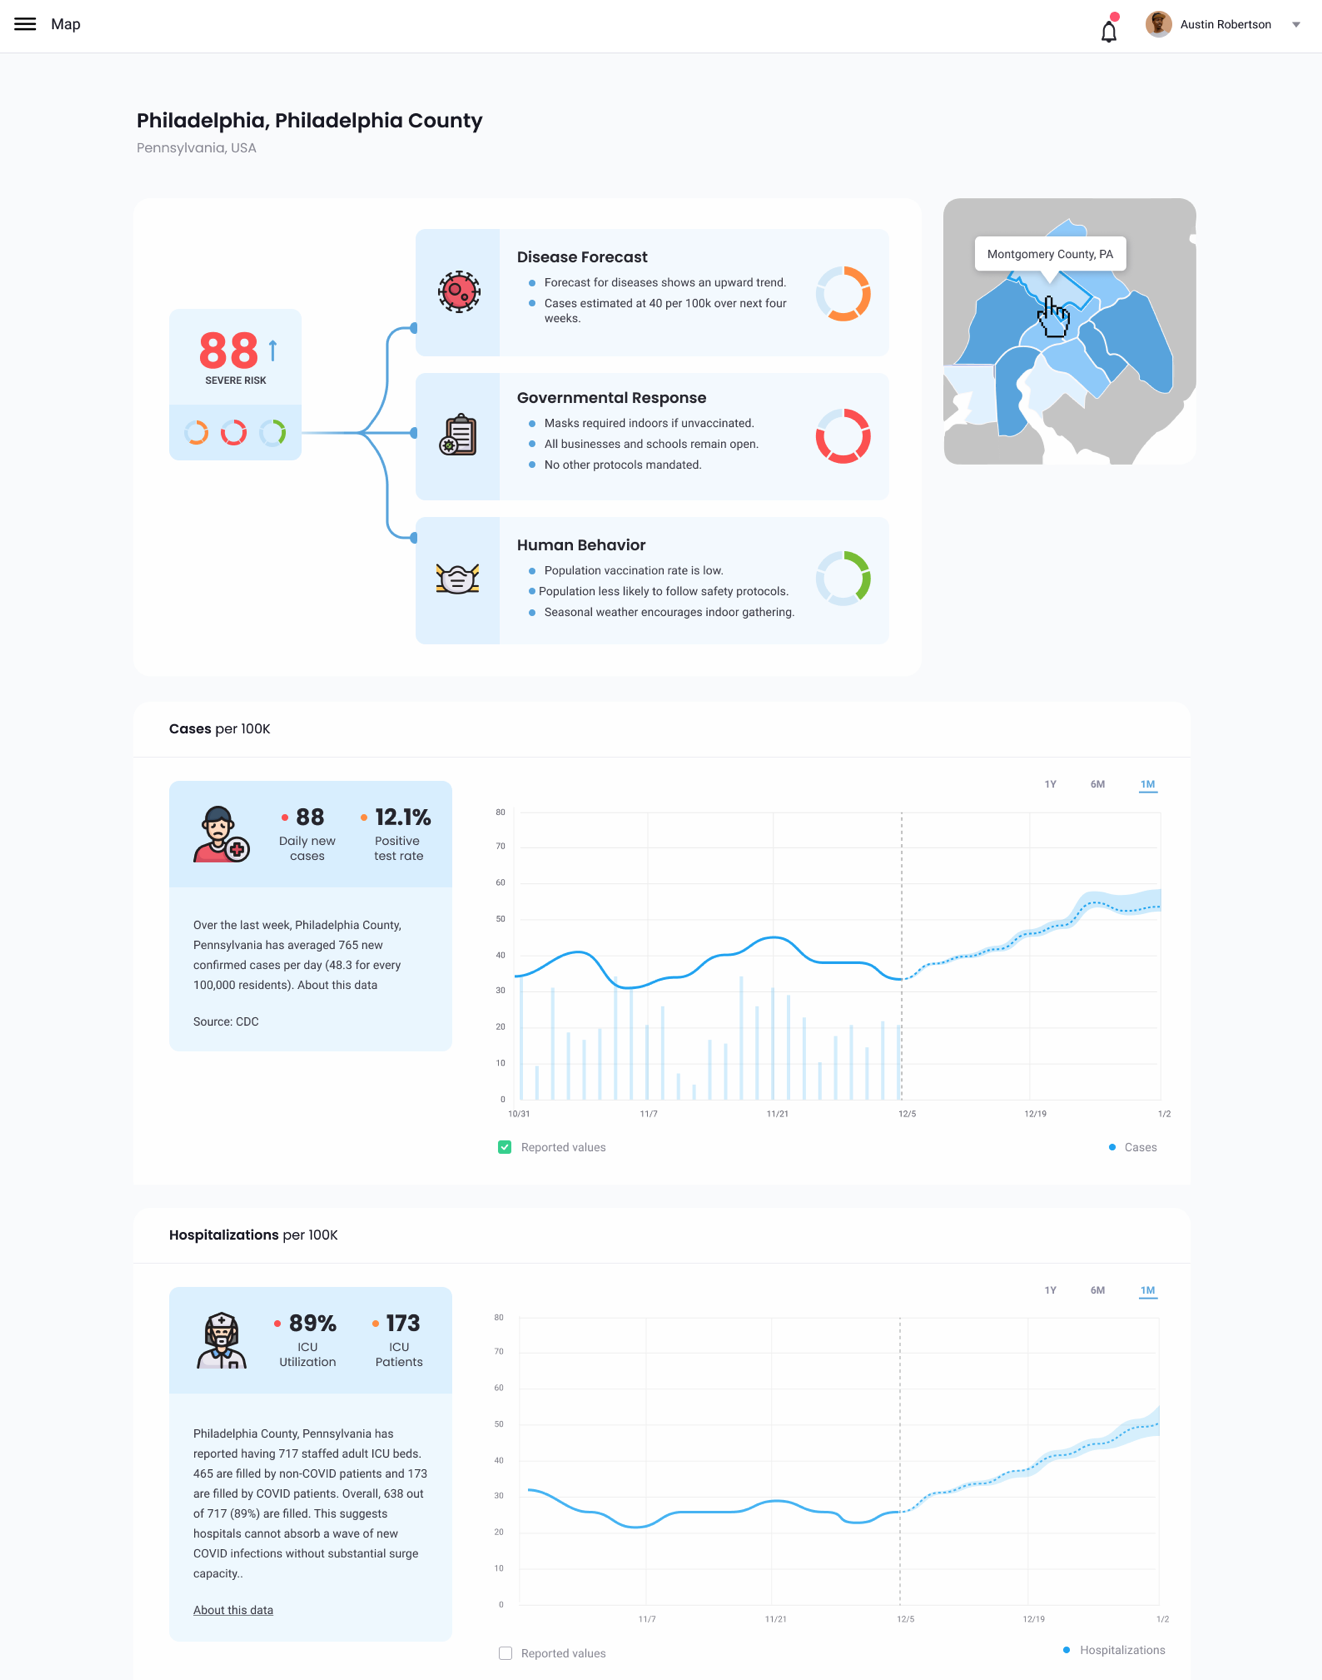
- A geographic and epidemiological breakdown for Philadelphia County — showing disease forecast, governmental response protocols, and human behavior signals alongside case count and hospitalization data. This view was designed to give on-site staff and regional managers the context they need to make informed decisions about their specific location.